API Discovery Setup  
This article describes how to enable and configure Wallarm's API Discovery.
Requirements
-
Advanced API Security subscription plan
-
For GraphQL - NGINX Node 6.1.0+ or Native Node 0.15.1+.
-
For SOAP - NGINX Node 6.3.0 or Native Node 0.17.1+.
-
For gRPC - NGINX Node 6.4.0 or higher (not supported by Native Node so far)
API Discovery is included in all forms of the Wallarm node installation. During node deployment, it installs the API Discovery module but keeps it disabled by default.
Enabled by default
API Discovery is included in all forms of the Wallarm node installation and is enabled by default, analyzing all traffic going through Wallarm nodes.
Configure
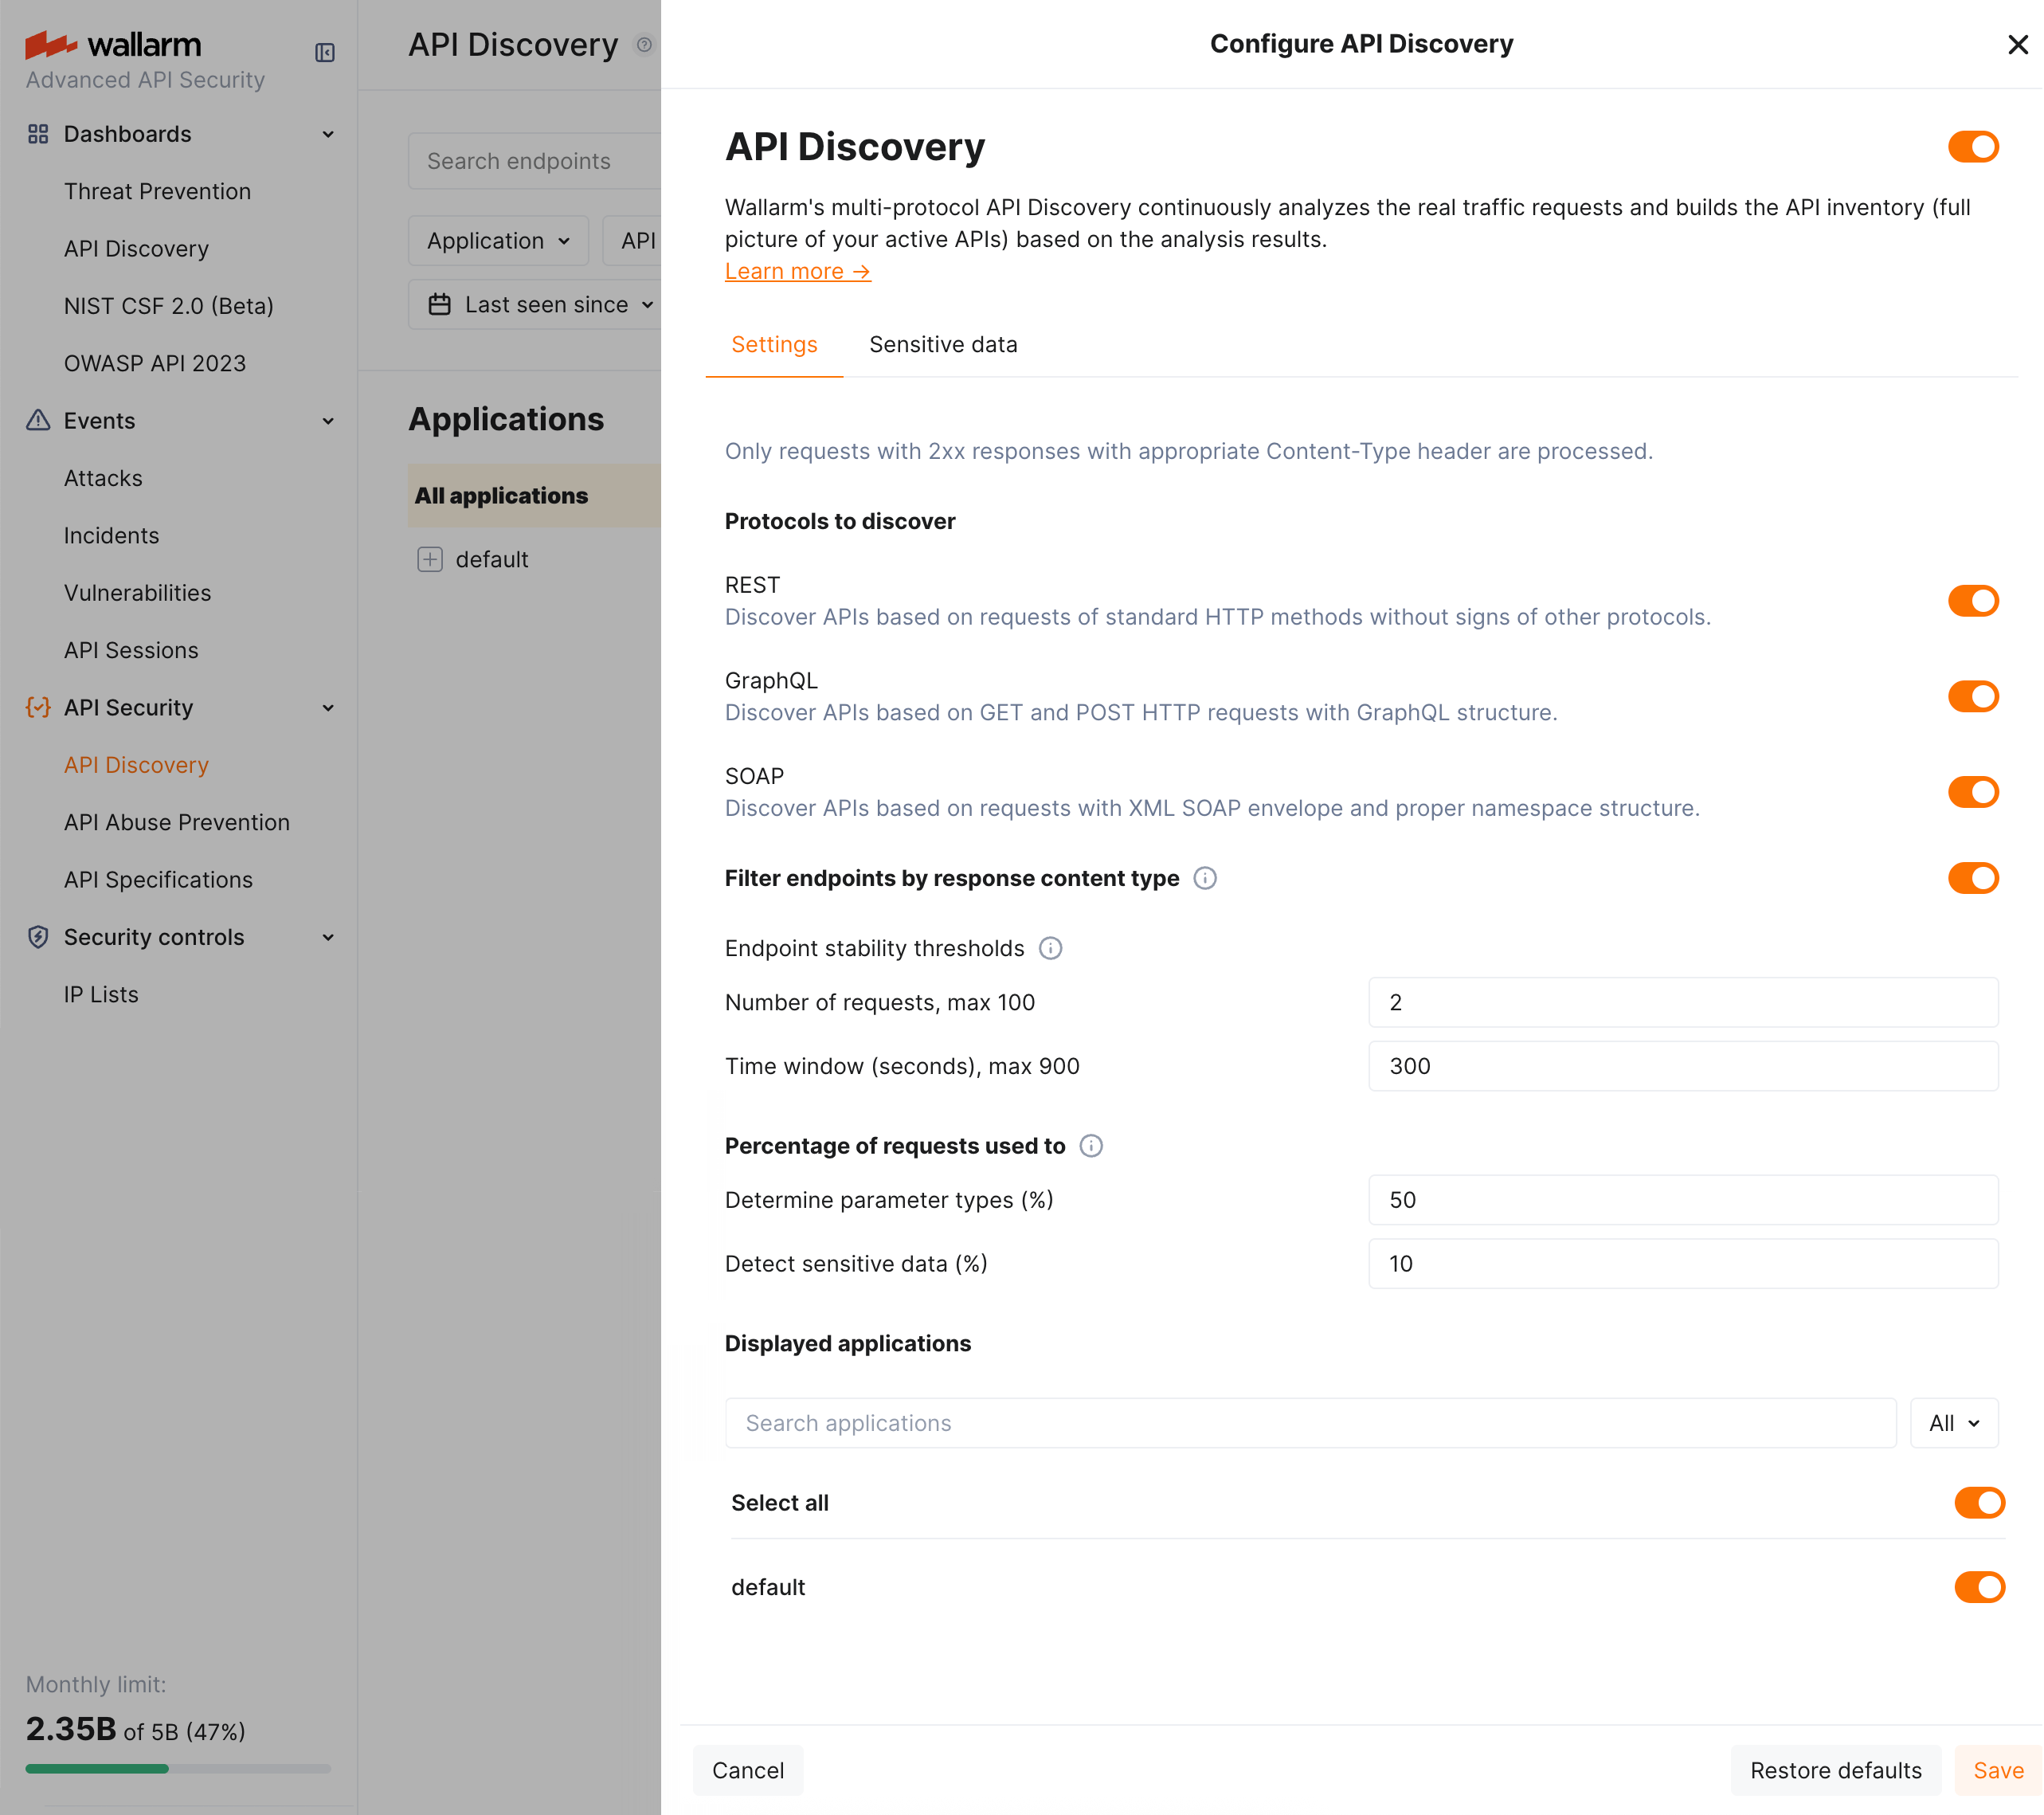
By clicking the Configure button in the API Discovery section, you proceed to the API discovery fine-tuning options, including selection of protocols to be handled, general settings for how API Discovery processes traffic, displayed applications, and customizing the sensitive data detection.
General API Discovery settings
You can get define general API Discovery settings in Wallarm Console → API Discovery → Configure → Settings.
Parameter availability
Some of the parameters may be unavailable if they are managed by a global administrator of multi-tenant Wallarm installation.
They are:
-
Protocols to discover: note that if you already have discovered data for some of the protocols and then deselect this protocol in settings, its data will remain and will still by displayed, but the new endpoints for the corresponding protocol will stop appearing, those already found will stop being updated.
-
Parameters defining how API Discovery detects noise to show only relevant APIs. This is important as API Discovery bases its findings on the real traffic:
-
Filter endpoints by response content type turns on/off validation of traffic by the
Content-typeheader of response. The necessity of this validation in noise reduction depends on the peculiarities of your traffic. -
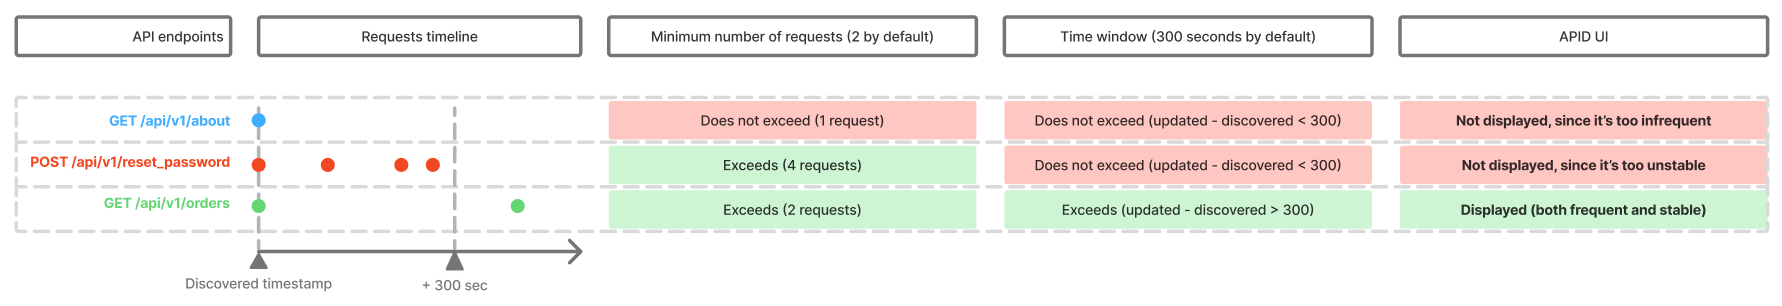
Endpoint stability thresholds: at least specific number of requests should be registered for the endpoint for it to be displayed by API Discovery AND and at least one of them must be outside the timeframe.
This settings aim to avoid showing API entries, that had no traffic or had a traffic for a short timeframe only - they are considered unstable. Even if the specific endpoint was requested huge amount of times, but just within a short timeframe, there’s no need to consider this one-time spike as stable API endpoint.
-
-
Percentage of requests used to: determine parameter types (50% by default) and detect sensitive data (10% by default). Non-100% values are used to lower CPU usage. Increased numbers are good for environments with less requests.
-
Applications to be displayed: only data for the selected applications will be displayed by API Discovery. Note that this is about displaying: data is discovered for all applications, you just decide whether to show it.
Customizing sensitive data detection
API Discovery detects and highlights sensitive data consumed and carried by your APIs. You can fine-tune the existing detection process and extend it with your own data types to detect.
To view the current configuration and perform changes, in Wallarm Console, go to API Discovery → Configure → Sensitive data. Here, you can overview and modify the existing sensitive data patterns and add your own.
Custom manual variability
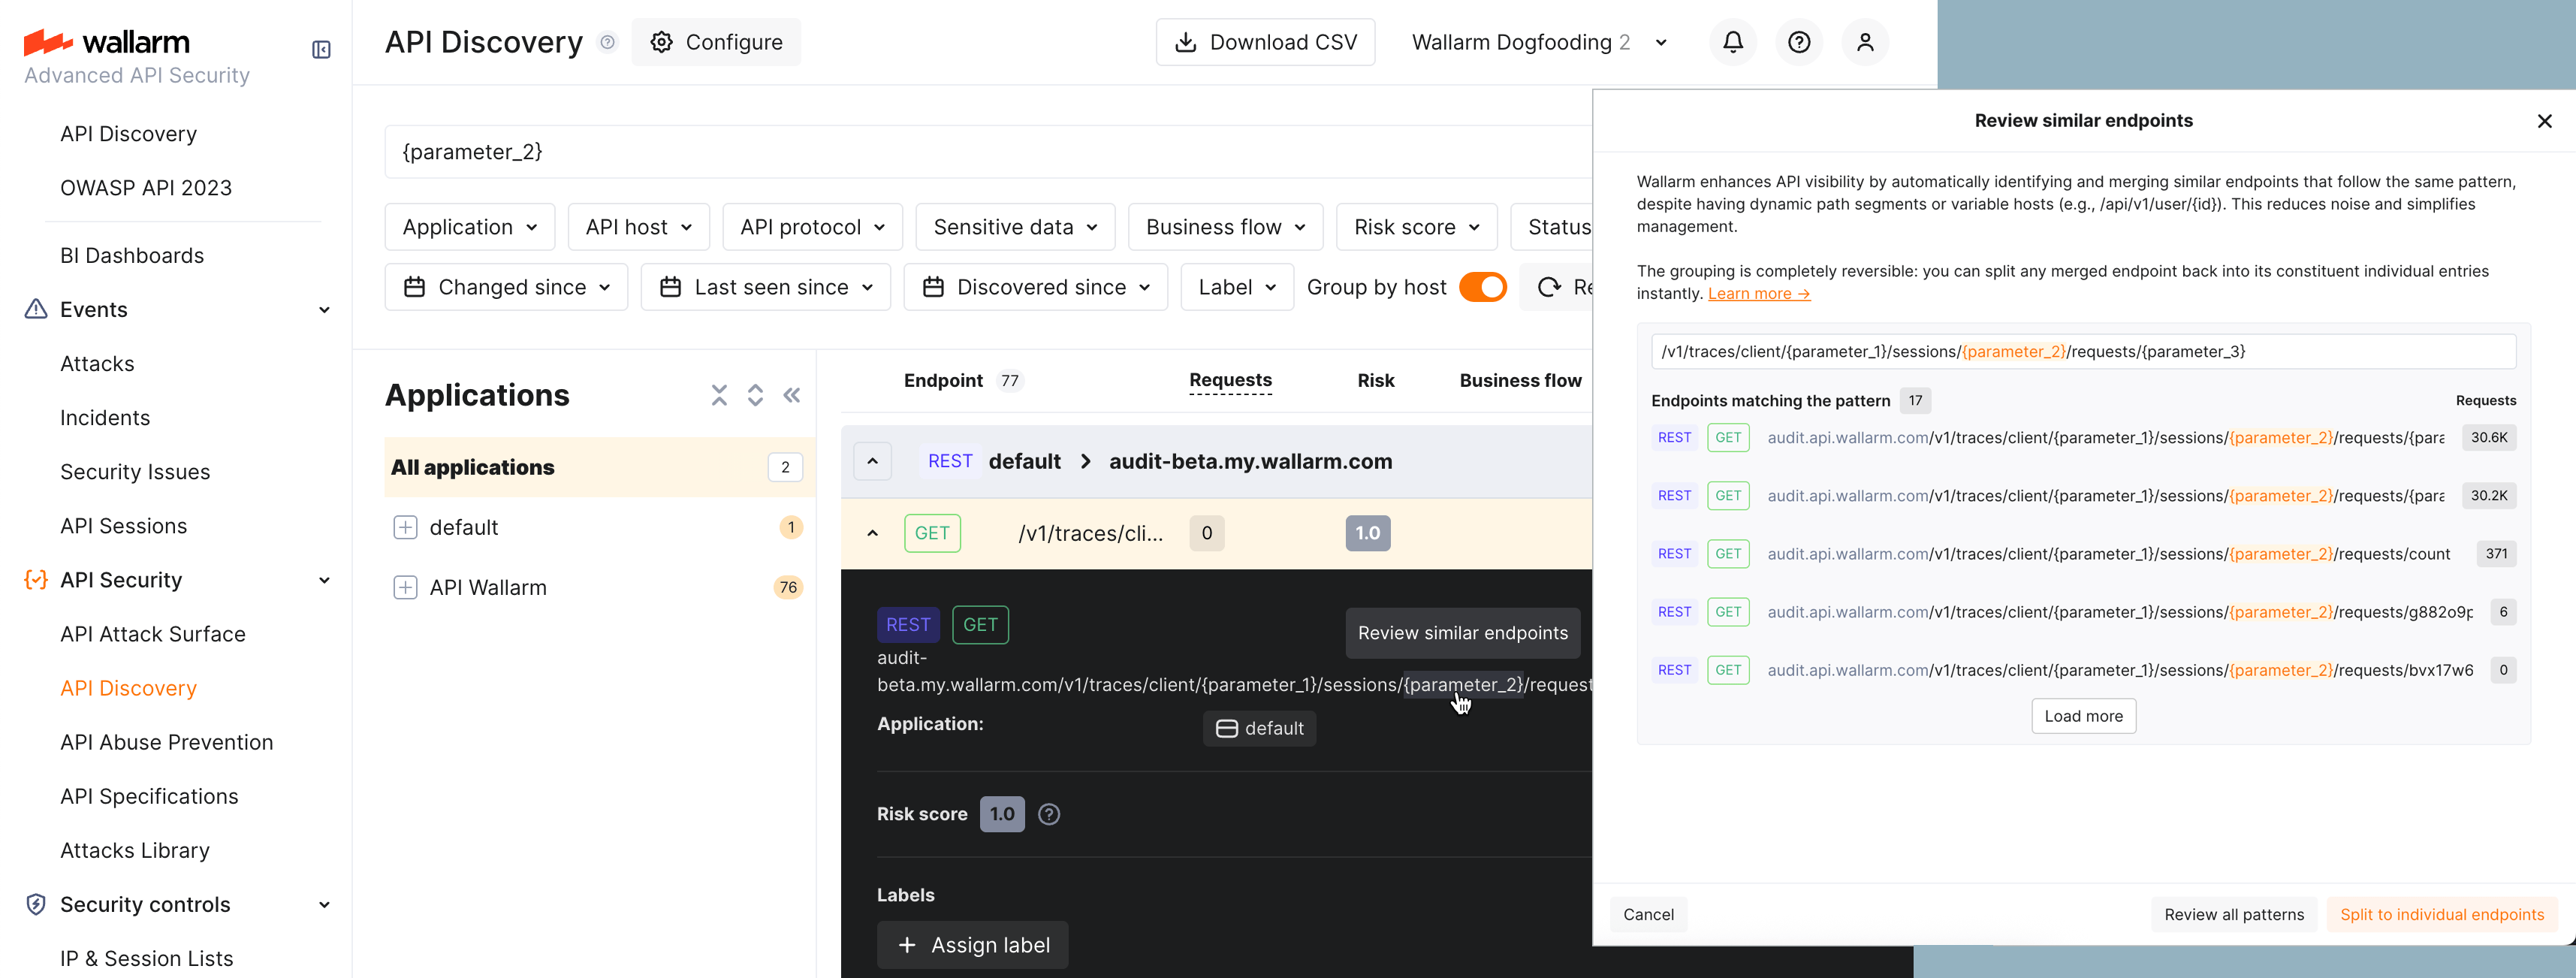
In addition to automatic variability (unifying path segments such as UUIDs or numeric IDs into {parameter_X}), you can define custom manual variability—your own path patterns so that API Discovery treats certain URL segments as variable and merges them into one endpoint in the inventory.
-
What it does: You define path patterns; API Discovery treats matching URL segments as variable and merges them into a single endpoint.
-
When to use it: When your APIs contain path elements where it is not immediately obvious they should be treated as variable (e.g., language codes or region-specific values, like
/website/lang/en_US,/website/lang/de_DE,/website/lang/fr_FR) and you want to explicitly control how these are grouped in your inventory. Where variable segments are "obvious" (e.g., UUIDs, numeric IDs), automatic variability will handle them without any manual intervention. -
Why: The catalog stays concise and reflects the real structure of your API.
How to configure:
-
To merge endpoints: In API Discovery, go to the details of an endpoint with an unmerged (variable) path segment. Mouse over the segment and click Merge similar endpoints to create a pattern that unifies them.
-
To review or split a merged pattern: In the details of an endpoint with a merged segment, mouse over the merged segment and click Review similar endpoints. In the review window, you'll see all endpoints currently grouped by this pattern; if needed, you can break the group apart by clicking Split to individual endpoints.
-
Disabling vs. deletion: Disabling a pattern (either by turning it off in the list or using Split to individual endpoints) only makes the pattern inactive—endpoints will be shown separately again, but the pattern itself remains available and can be re-enabled at any time. However, if you choose to Delete a pattern, it is permanently removed and cannot be restored or used again in the future.
-
Full list of your custom patterns is always available in API Discovery → Configure → Variability.
Applying changes
Both merge and split take time—changes are reflected in the list within 5 minutes.
Notifications
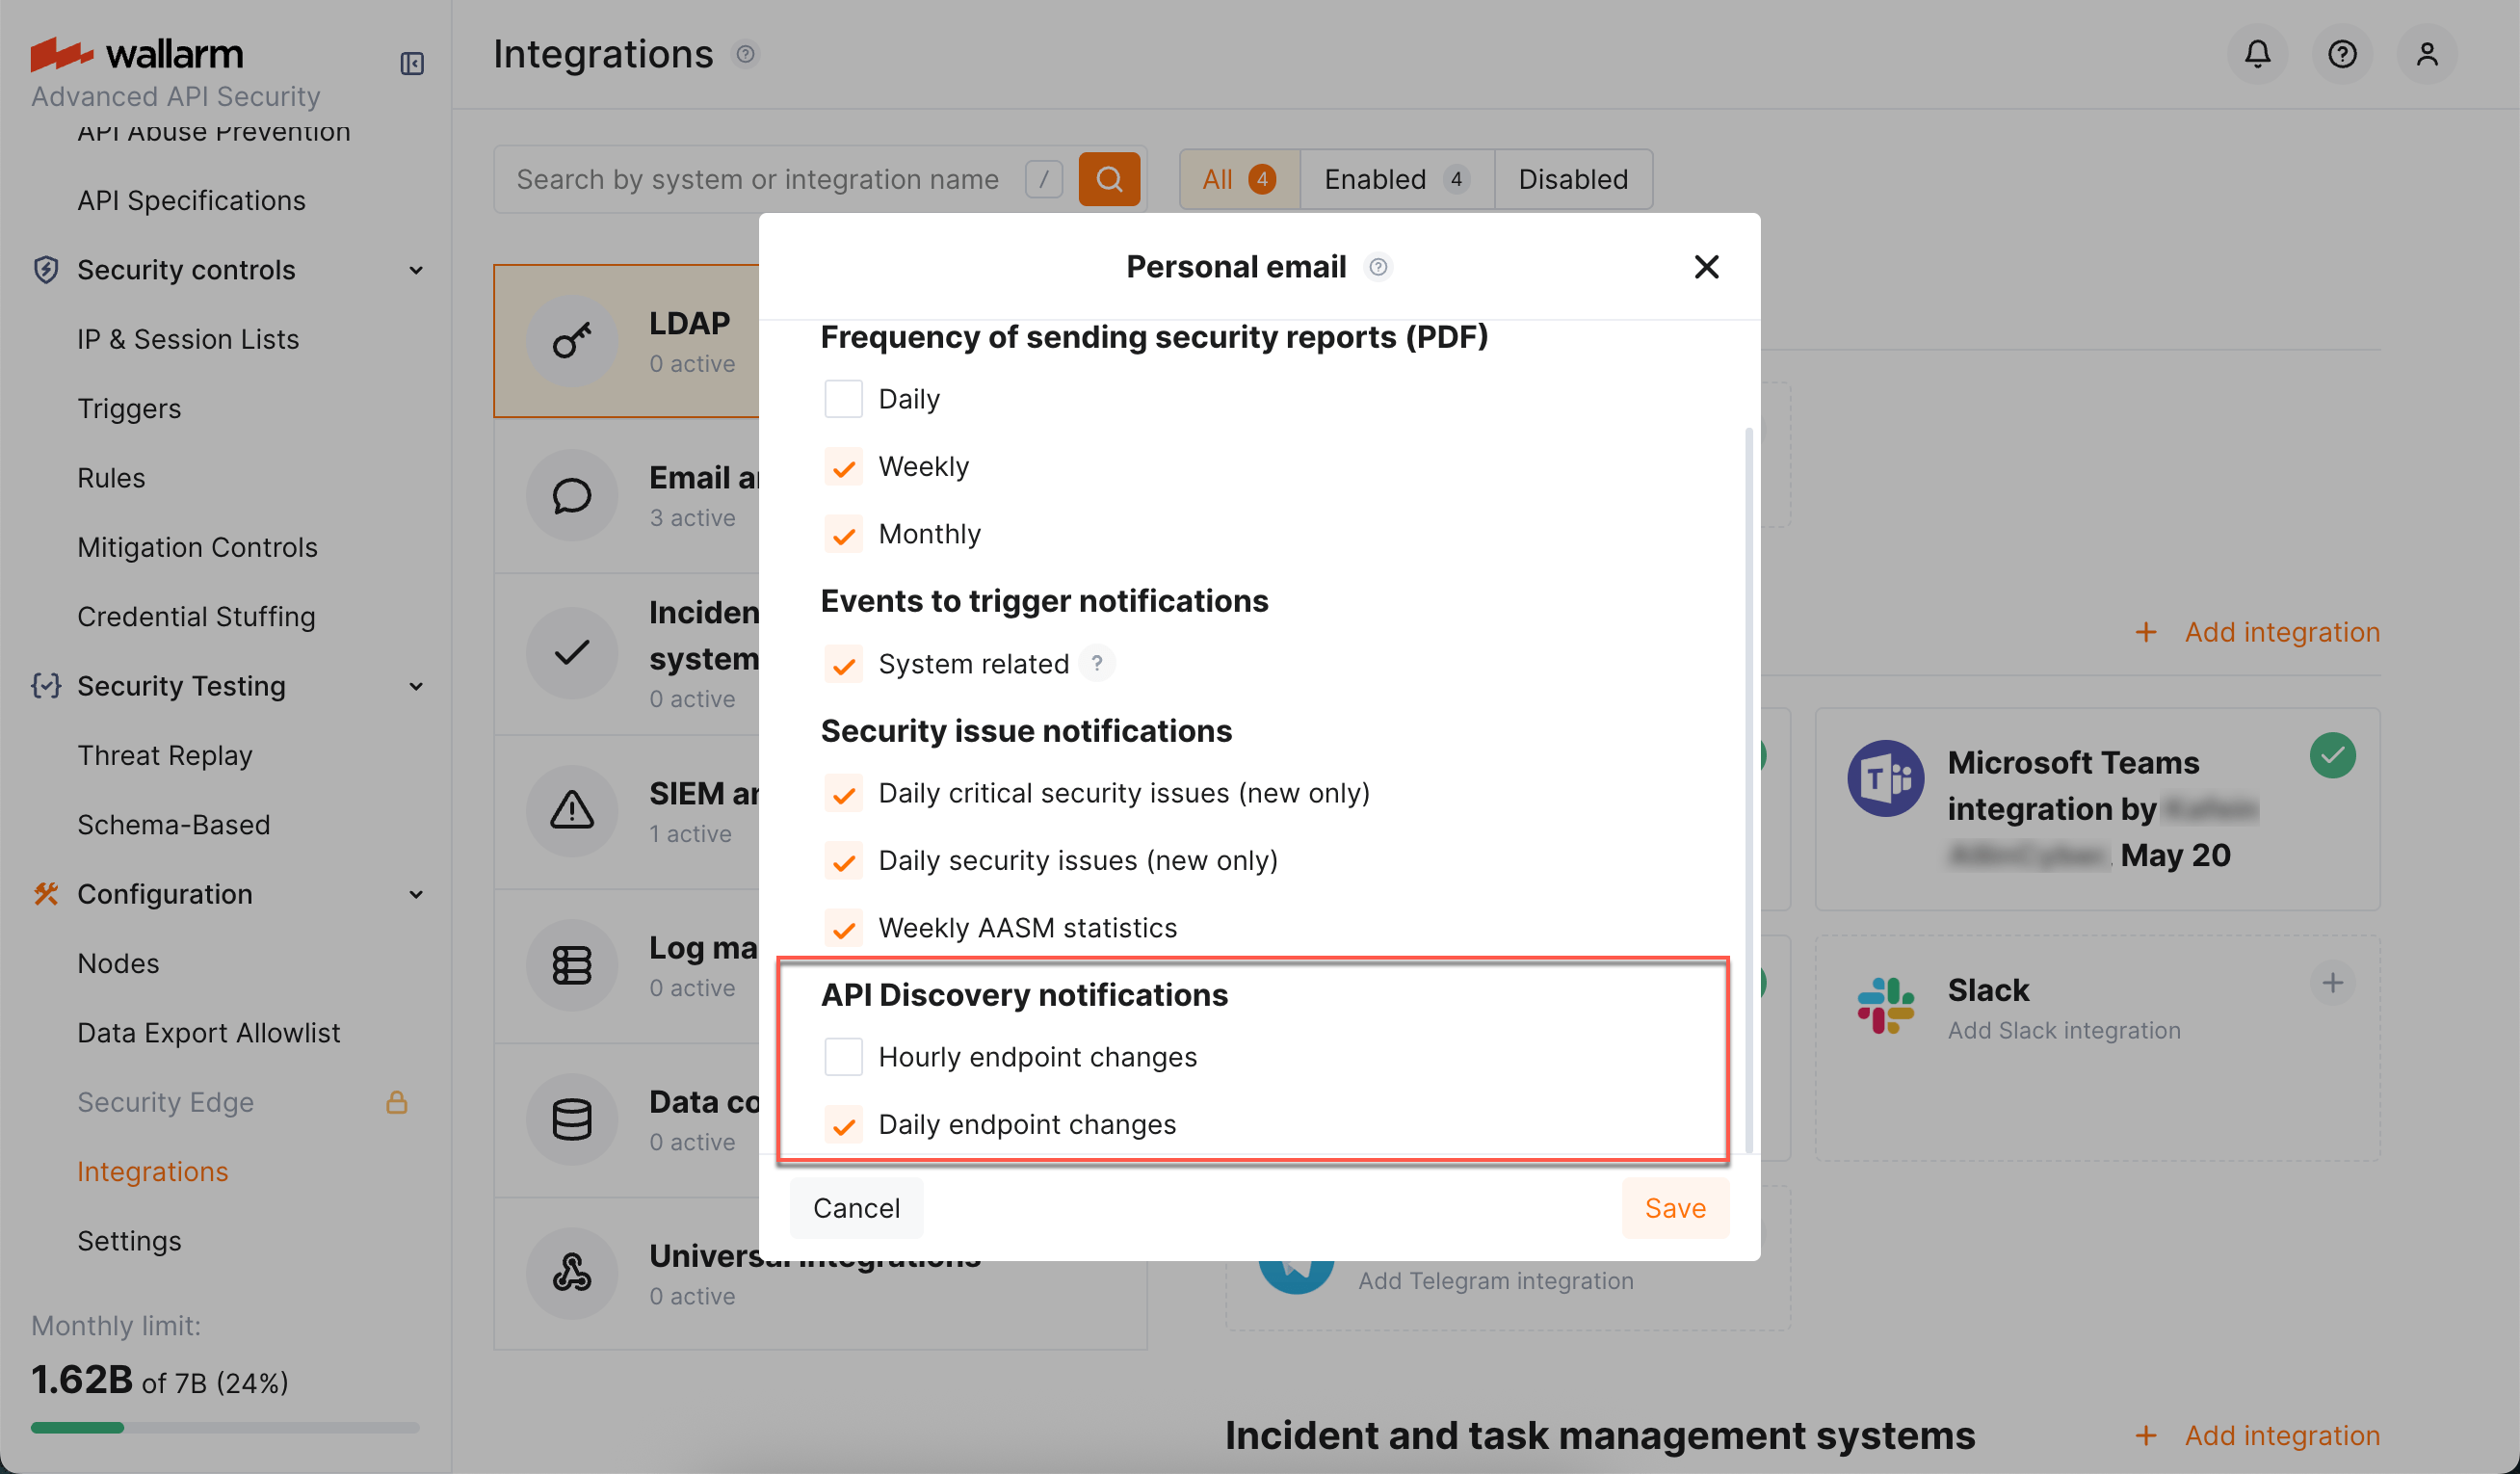
You can set up API Discovery notifications to be sent to your personal email (the one you use to log in) and to any additional emails:
-
Access Wallarm Console → Configuration → Integrations → Email and messengers:
- → Personal email, to setup notifications to your email
-
→ Email report, to setup notifications to additional emails
Learn more about working with email integrations.
-
In the API Discovery notifications section select notifications you want to get (hourly or daily notifications on new and changed endpoints).
Debug
To get and analyze the API Discovery logs, you can read the log file /opt/wallarm/var/log/wallarm/appstructure-out.log on the Linux machine where the node is running.→